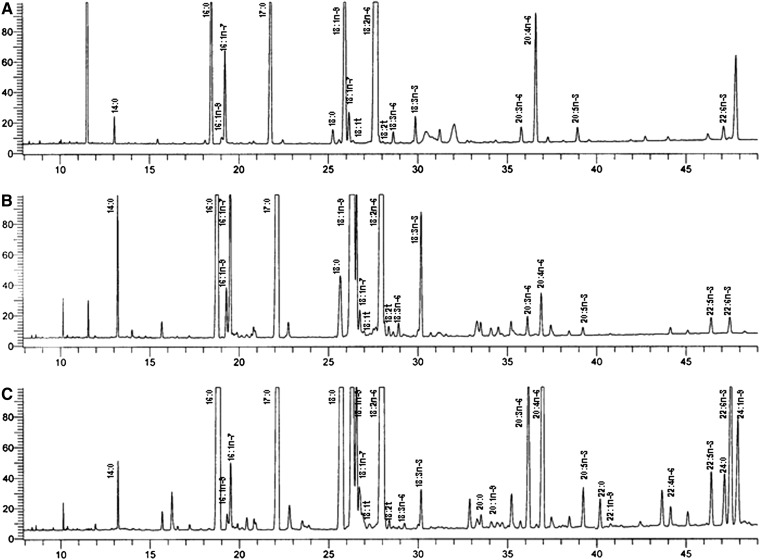
Fig. 2.
Representative gas chromatogram of the serum CE (A), TG (B), and PL (C) fatty acid profile of one subject at the time of the repeat analysis. The x axis denotes the run time in minutes and the y axis the response time in millivolts (mV). The scale has been magnified to highlight the fatty acid peaks of interest.

