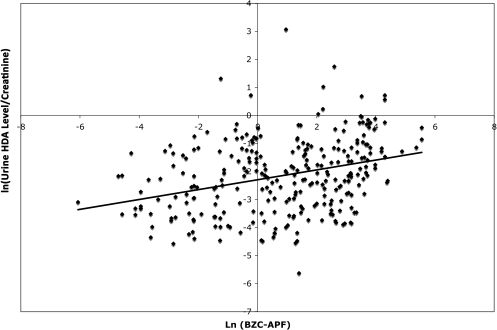
Fig. 3.
The relationship between natural log-transformed BZC–APF exposure and natural log-transformed urine HDA levels adjusted for creatinine in samples collected from 48 spray painters exposed to HDI in North Carolina and Washington State. The line indicates the best-fit linear regression (R2 = 0.10). (Note: Since multiple imputation creates 10 different datasets, for this figure, all nondetectable levels of urine HDA and BZC were assigned a value of the LOD/√2 instead of multiple imputation used for the models.)

