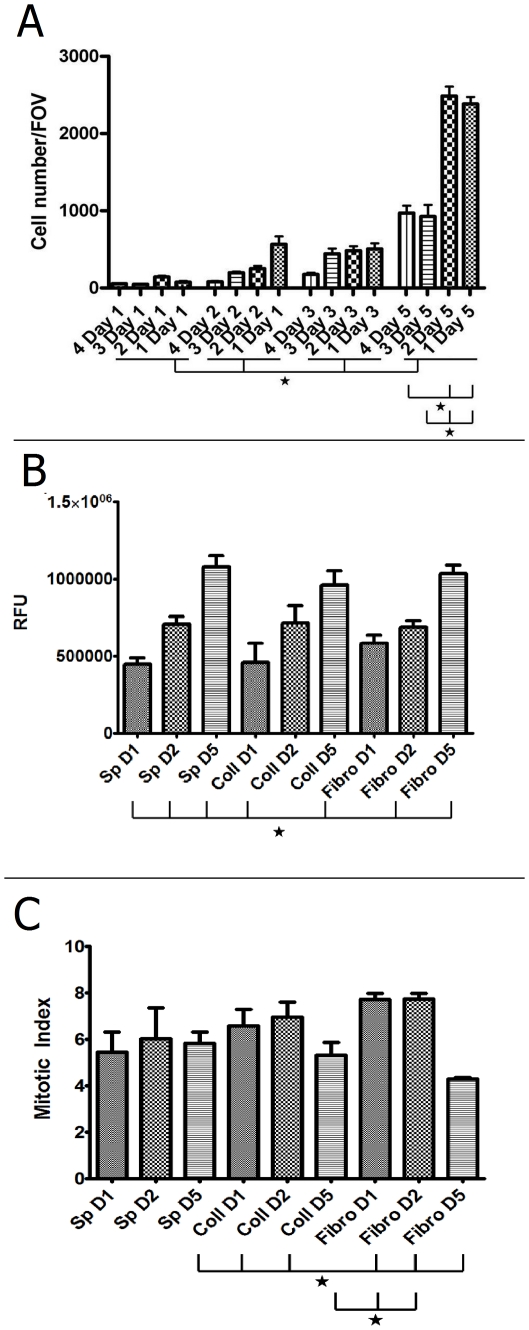
Figure 5. Quantification of time-dependent adhesion/proliferation during incubation.
A: Cell count of the proliferation assay, numbers of visible DAPI-stained cell nuclei were counted in fields of vision (FOV) with n = 10 for each specimen, with each specimen treated in quadruplicate. 1 = Collagen-coated cover slip, 2 = Fibronectin-coated cover slip, 3 = weaving frame with native spider silk, 4 = weaving frame with trypsin-treated spider silk. Error bars indicate standard error means, asterisks mark significance level p<0.05. B: Measurement of relative fluorescence of Tubulin in cells either on spider silk weaving frames, collagen-coated controls or fibronectin-coated controls, depicted as relative fluorescent units (RFU). Error bars indicate standard error means, asterisks mark significance level p<0.05. C: Mitotic index of proliferating cells either on spider silk weaving frames, collagen-coated controls or fibronectin-coated controls, calculated by dividing RFU values of Tubulin-positive cells by RFU values of Phospho-Histone H3-positive cells (see text). Error bars indicate standard error means, asterisks mark significance level p<0.05.

