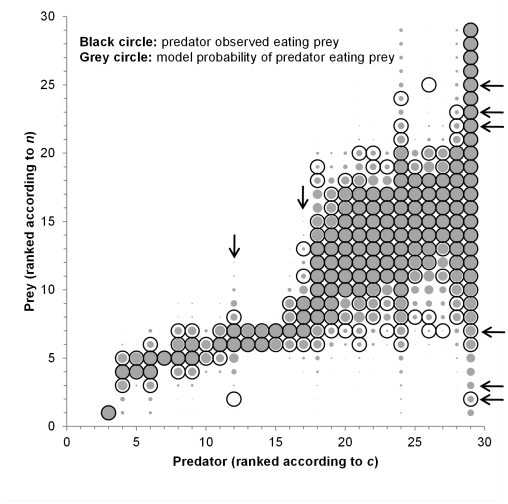
Figure 2. Probabilistic niche model results for the Benguela food web.
Feeding links in the empirical data set and feeding probabilities in the probabilistic niche model for the maximum likelihood estimate (MLE) parameter set. On the x-axis, predators are ordered by their estimated (MLE) ci values; on the y-axis, prey are ordered by their estimated (MLE) ni values. Model predictions, calculated at the MLE, are shown as the grey circles: the area of each circle is proportional to P(nj, ri, ci), the probability that i eats j. Apparent missing grey circles simply correspond to very low values of P(nj, ri, ci). Observations are shown in black: a black circle is shown for those feeding relationships that have been observed. A match between large grey circles, and the black circles, implies a close match between model and data. Two predators with poorly predicted prey (expected fraction of prey links ≤0.65), other pelagic and chub mackerel, are labelled with arrows. Six prey species with poorly predicted predators (expected fraction of predator links ≤0.65) are labelled with arrows: from bottom to top, gelatinous zooplankton, bacteria, macrozooplankton, snoek, sharks and kob.

