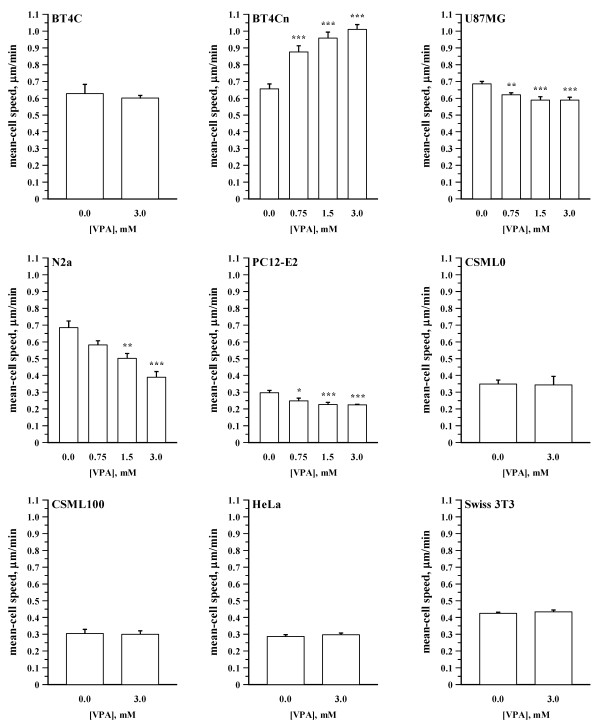
Figure 4.
Effects of VPA on individual cell motility. Bar graphs showing the effects of VPA on the cell speed. Cells were exposed to VPA (0-3 mM, 48 h) before individual cell motility was recorded. BT4C and BT4Cn cells were recorded for 20 min at 5 min intervals. The remaining cell lines were recorded for 40 min at 10 min intervals. Results were normalized to the corresponding cells untreated with VPA from four to six independent experiments, each being based on analysis 50-200 cells/treatment.

