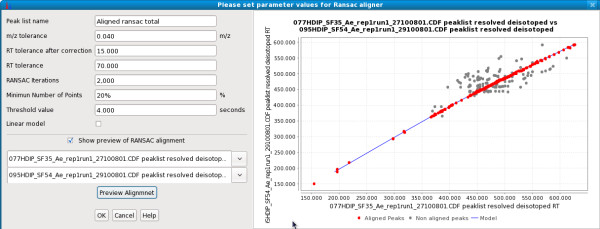
Figure 5.
RANSAC aligner. Dialog shows preview of RANSAC alignment of two peak lists using the given parameters. Each possible candidate alignment (peak pair) within a defined m/z and retention time tolerance is shown as a dot. A model is fitted to the data (blue line) and red dots indicate those fitting to the model and therefore selected for the final alignment.

