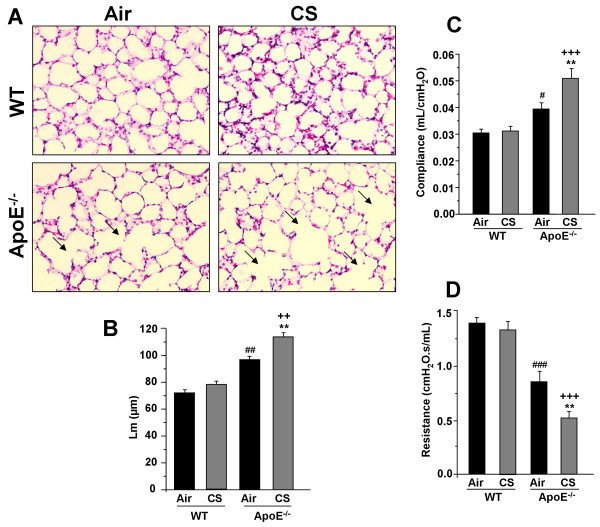
Figure 4.
Airspace enlargement and lung mechanical properties in ApoE-/- mice exposed to CS. Representative figure of H&E stained lung sections from air- and CS-exposed WT and ApoE-/- mice (A). Arrows indicate alveolar enlargement. Mean linear intercept (Lm) was calculated in H&E stained lung sections. Original magnification: ×200. Histogram represents (B) mean ± SEM (n = 3-4 mice per group). **P < 0.01, significant compared with corresponding air-exposed mice. ++P < 0.01, significant compared with CS-exposed WT mice. ##P < 0.01, significant compared with air-exposed WT mice. Lung compliance (C) and resistance (D) were measured in air- and CS-exposed WT and ApoE-/- mice using Flexivent. Data are shown as mean ± SEM (n = 3-4 mice per group). **P < 0.01, significant compared with corresponding air-exposed mice. +++P < 0.001, significant compared with CS-exposed WT mice. #P < 0.05, ###P < 0.001, significant compared with air-exposed WT mice.

