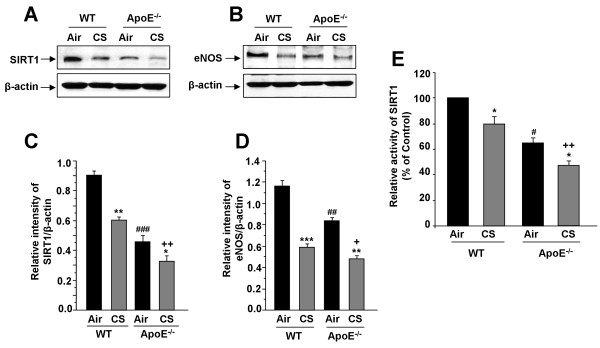
Figure 6.
SIRT1 levels and activity, and eNOS level in lungs of ApoE-/- mice exposed to CS. SIRT1 and eNOS levels were measured in lungs of WT and ApoE-/- mice exposed to CS (A and B). Histograms (C and D) represent mean ± SEM of relative levels of SIRT1 and eNOS respectively (n = 3-4 per group). SIRT1 deacetylase activity was measured in lungs of WT and ApoE-/- mice exposed to CS (E). *P < 0.05, **P < 0.01, ***P < 0.001 significant compared with respective air-exposed mice. +P < 0.05, ++P < 0.01, significant compared with CS-exposed WT mice. #P < 0.05, ##P < 0.01, ###P < 0.001, significant compared with air-exposed WT mice.

