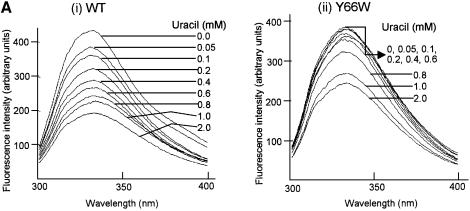
Figure 7.
Spectrofluorimetric analyses. (A) Wild-type and Y66W UDGs (1 A280/ml) were incubated with different concentration of uracil (i and ii, respectively) at room temperature for 2 h and the fluorescence spectra (300–400 nm) were recorded upon excitation at 280 nm. (B) (i) The mean values of relative fluorescence (Fx / Fo) from three independent experiments [a representative set is shown in (A)] were calculated and plotted against the ligand concentration [Fo represents the fluorescence intensity at 332 nm (λmax) of the untreated control sample whereas Fx represents fluorescence intensity at 332 nm (λmax) at a given concentration of uracil or 5-bromouracil]. (ii and iii) Same as in (i), except that the data from single sets of experiments wherein the UDG–Ugi complexes or UDGs were treated with uracil (ii) or 5-bromouracil (iii), respectively, are shown.


