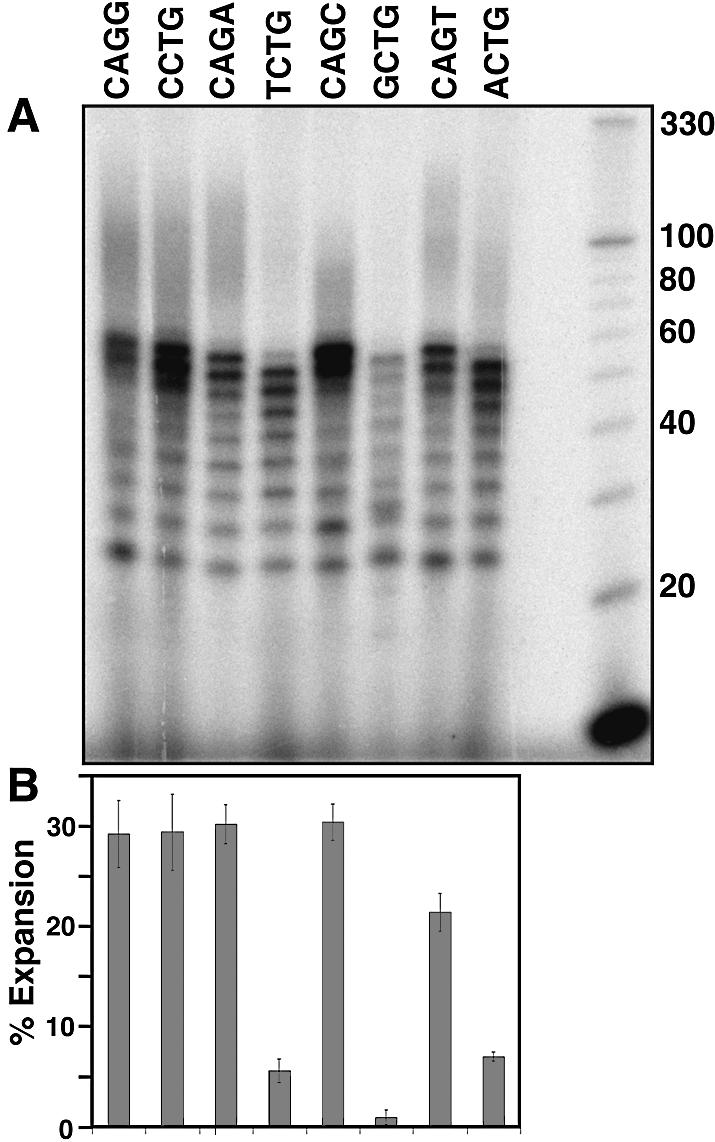
Figure 3.

Comparison of expansion of the different repeat sequences at a single time point (60 min). (A) Gel analysis of the repeat expansion reaction products. Reaction products were resolved on a denaturing 12% polyacrylamide gel containing 7.5 M urea. Base sequences above each lane are the repeat sequences of the primers used in each expansion reaction. Repeat expansion reactions were carried out for 60 min at 37°C. (B) Bar graph summarizing quantitation of the expansion results. Bars correspond to the sequences shown in the top panel, and represent the percentage expansion (as defined in Fig. 2), and are the average of two determinations. The error bars indicate the variance between the two determinations.
