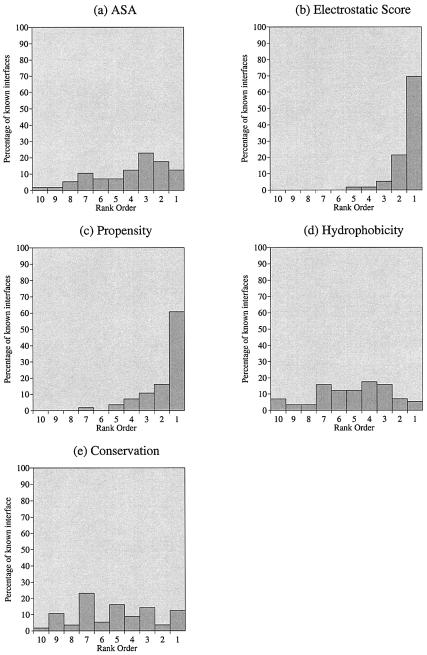
Figure 2.
Patch analysis distributions for 56 proteins bound to dsDNA, showing the rank ordering (on a scale of 1–10) of known DNA-binding sites relative to other patches on the surface of the protein. The 56 observations were combined for each parameter separately: (a) ASA, (b) electrostatic score, (c) residue interface propensity, (d) hydrophobicity and (e) residue conservation.

