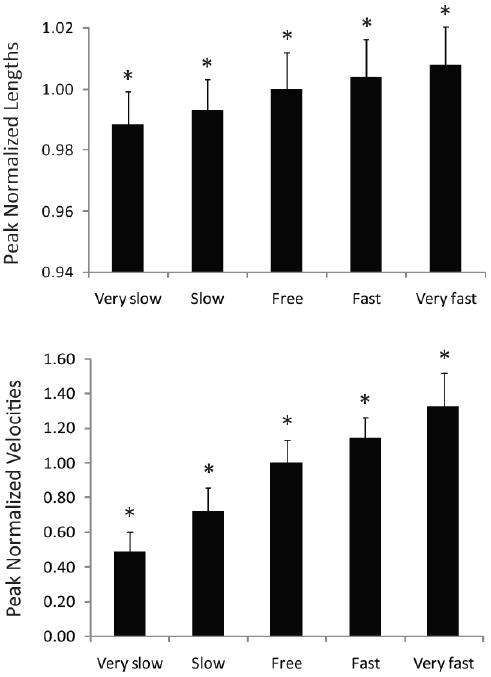
Figure 2.

Mean peak semimembranosus muscle-tendon lengths (top) and velocities (bottom) for each speed. Mean peak muscle-tendon length and lengthening velocity increased between each walking speed. Error bars show one standard deviation. The * indicates that the mean is significantly different (p < 0.01) from neighboring means. Peak muscle-tendon lengths are normalized to the peak semimembranosus length at free speed. Peak velocities are normalized to the peak semimembranosus velocity at free speed.
