
Figure.
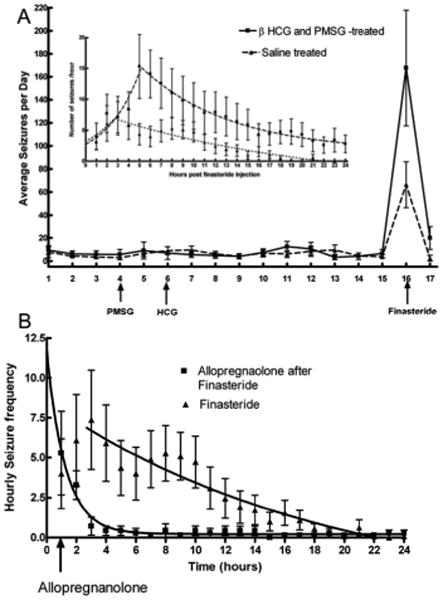
Figure A: Average daily seizure frequency in epileptic animals monitored with video and EEG. Animals treated with PMSG and βHCG (n = 11) were studied in parallel with those treated with saline (n=11). Finasteride caused a marked exacerbation of seizure frequency in both PMSG and HCG-treated and in saline-treated epileptic animals. Inset: The seizure frequency following finasteride administration was plotted on an hourly basis to display the rate of rise and decay of seizure frequency. The lines represent fit to the equation for an exponential curve (Y = start * e(kt)) in both groups of animals. Note gradual increase in seizure frequency and then return to baseline.
Figure B: Hourly seizure frequency in epileptic animals treated with finasteride alone (control animals in panel A) or finasteride followed 1 hour later by 30 mg/Kg allopregnanolone. Note both groups had similar seizure frequency before administration of allopregnanolone, but seizures slowed down and stopped rapidly in the allopregnanolone-treated animals. The lines represent best fit to the equation for an exponential decay and half life of decay was much shorter in allopregnanolone-treated group.