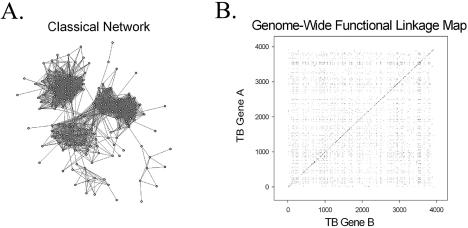
Figure 1.
A comparison of two methods for illustrating inferred protein functional linkages in the M.tuberculosis genome. (A) Classical representation of a protein network, consisting of nodes and edges. Each node represents a particular protein and each edge represents a functional linkage between two linked proteins. (B) Genome-wide functional linkage map representing all 9766 functional linkages inferred by two or more computational methods. Each of the functional linkages is depicted as a single point on this graph, where both the x- and y-axes are organized according to the order of genes along the M.tuberculosis chromosome. The dense clustering of functionally linked genes near the diagonal reflects both bacterial operon organization and close chromosomal proximity of genes of related function.

