Figure 1.
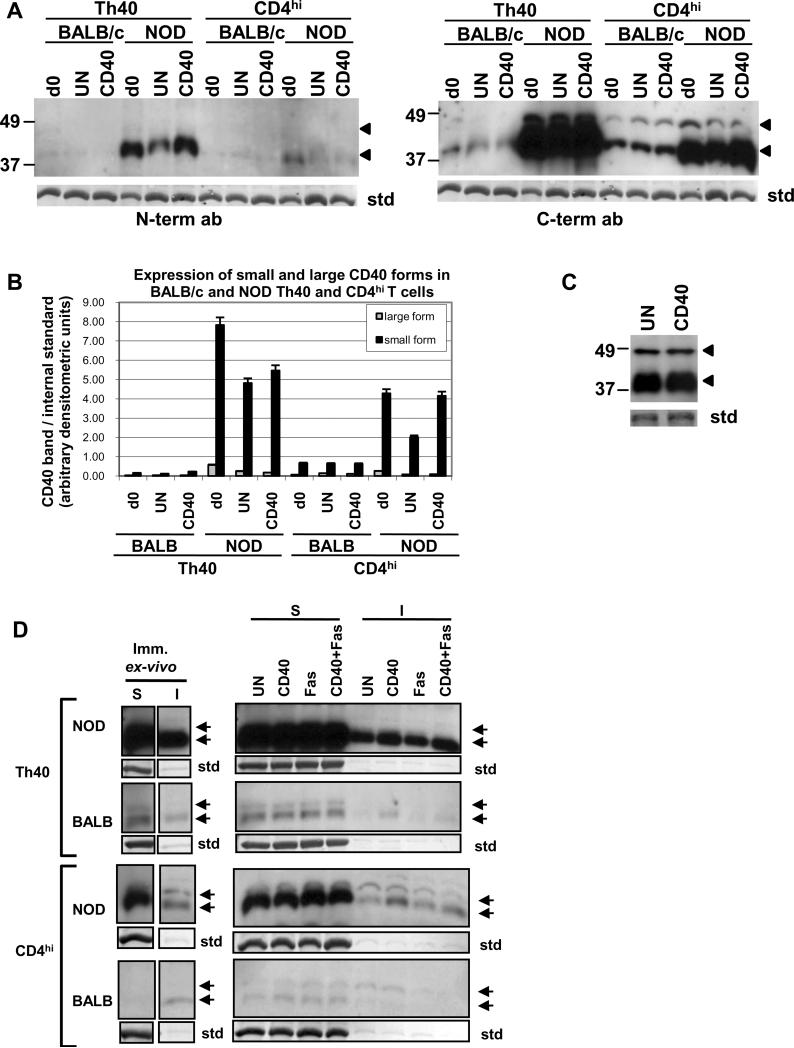
Th40 and CD4hi T cells were sorted from 10–16 weeks old NOD and BALB/c female spleens. (A) Cells were lysed immediately (d0) or incubated over night in the absence (UN) or presence of CD40 stimulation (CD40) then lysed. Equal amounts of protein were run in western blot and immunodetection was performed with a CD40 N-terminal reactive antibody then the membrane was stripped and reprobed using a C-terminal reactive antibody. (B) Graph representing the amount of small and large CD40 band. Data are represented as mean +/− SEM. (C) Th40 cells from female 4 week old NOD mice were incubated over night in the absence (UN) or presence of CD40 stimulation (CD40). Equal amounts of protein were run in western blot and immunodetection was performed with a CD40 C-terminal reactive antibody. (D) Cells treated as in A were fractioned into soluble (S; cytoplasmic) and insoluble (I; lipid raft) fractions. Western blot was performed using a CD40 C-terminal reactive antibody.
For an internal standard (std) in A and C and D the stripped membrane was stained with coomassie blue and a representative band is shown. Arrows indicate CD40 bands. Experiments were done at least three times.

