
Fig. 2.
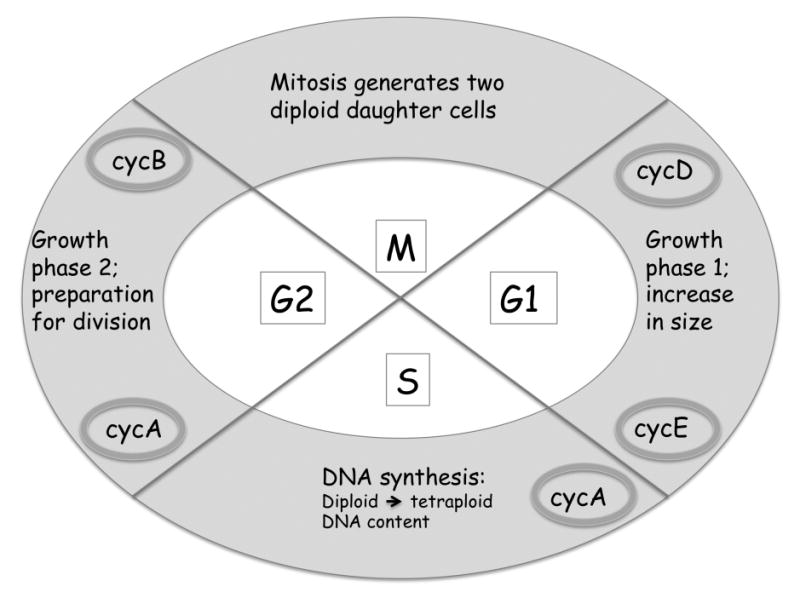
Schematic representation of the cell cycle. M, mitosis; G1, gap 1; S, synthesis; G2, gap2. Predominant cyclins (cyc) are shown in shaded ovals.
Official websites use .gov
A
.gov website belongs to an official
government organization in the United States.
Secure .gov websites use HTTPS
A lock (
) or https:// means you've safely
connected to the .gov website. Share sensitive
information only on official, secure websites.
Schematic representation of the cell cycle. M, mitosis; G1, gap 1; S, synthesis; G2, gap2. Predominant cyclins (cyc) are shown in shaded ovals.