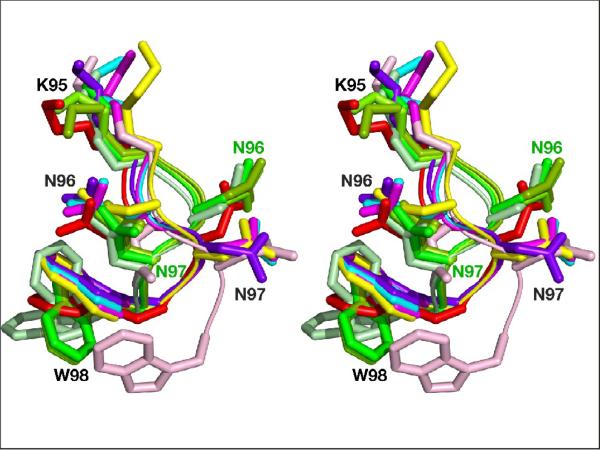
Figure 6.
Dual conformation of the loop 91–99 in HTLV-1 PR. The superimposed fragments of the loop comprising residues 94–98 are shown in ribbon representation. Five out of six loops with conformation 1 of the complex with the statine-based inhibitor are shown in green, whereas the sixth loop with conformation 2 is shown in red. Loops with conformation 2 in the complexes with other inhibitors are shown in pale pink, purple, yellow, magenta and cyan for KNI-10729, -10562, -10683, -10681 and -10673, respectively. The side chains of the residues of the loops are shown in stick representation.

