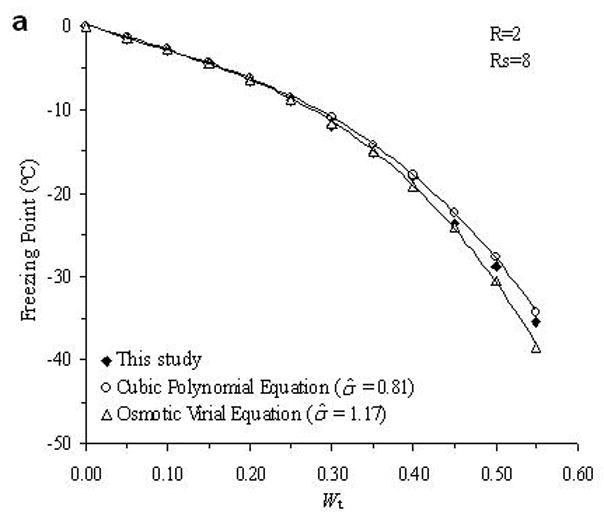
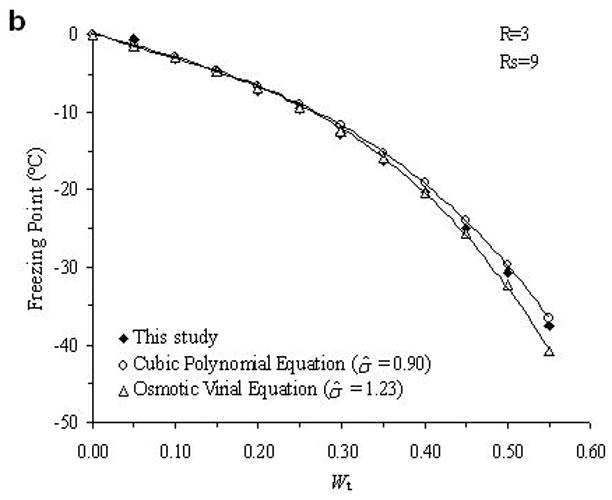
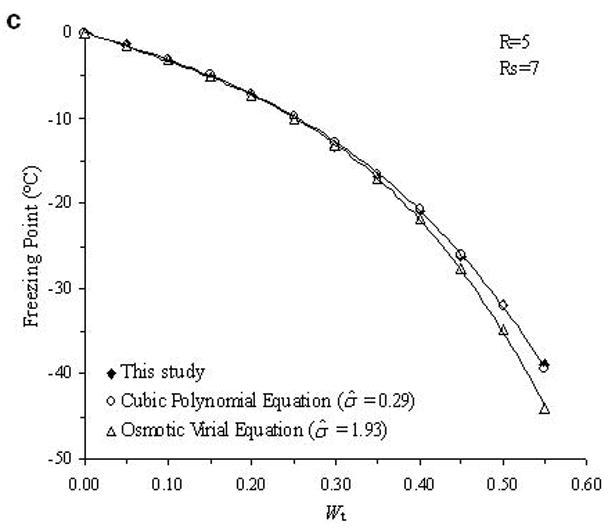
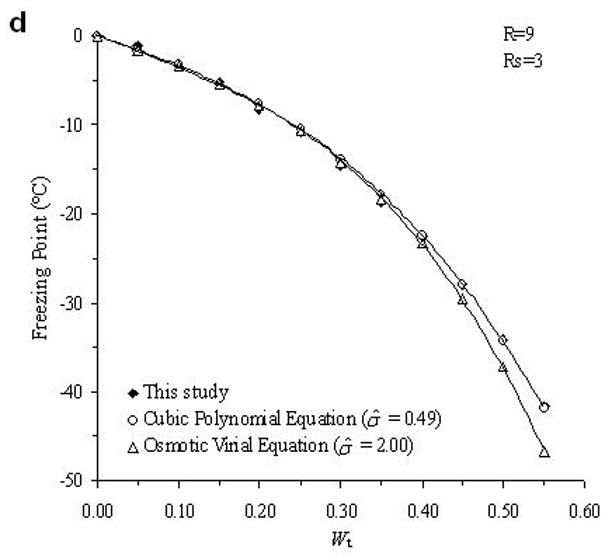
Fig. 3.


Examples of the comparison between the experimental data (black diamonds) of the determined phase diagram of the water-ethylene glycol-sucrose-NaCl system and the derived theoretical values from cubic polynomial equations (open circles) and osmotic virial equations (open triangles).
