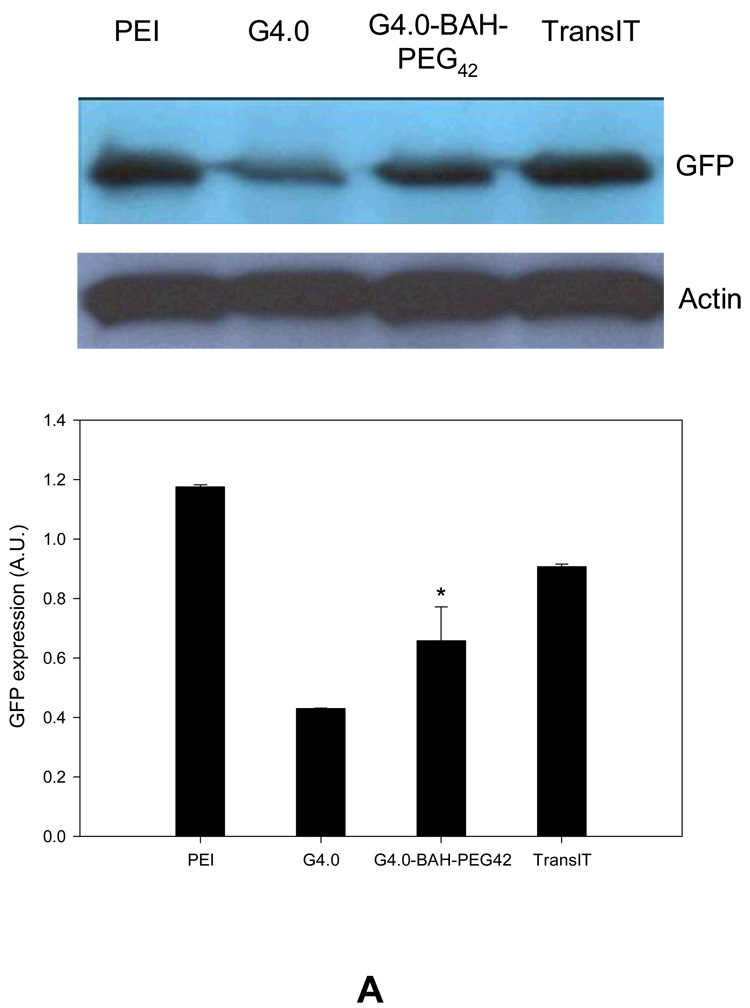
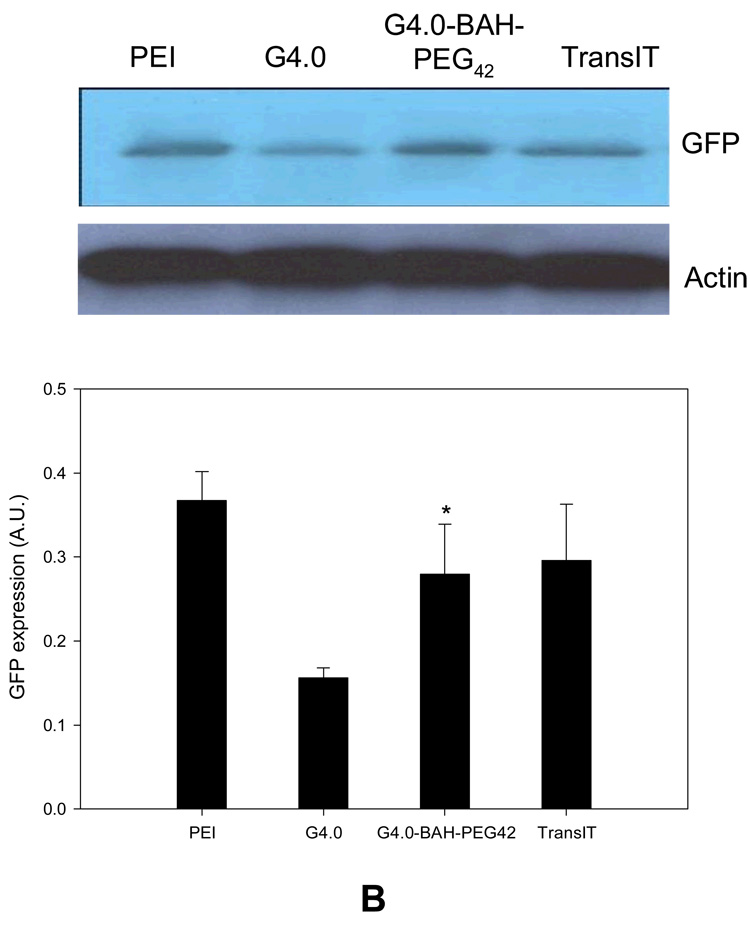
Figure 8.
Western blot analysis of GFP expression in 293T (A) and HN12 cells (B). The cells in 2 ml of growth medium containing 10% FBS were exposed to the polyplexes (PEI/plasmid: 20 µg/1 µg; TransIT/plasmid: 5 µL/1 µg; G4.0/plasmid: 100 µg/1 µg; G4-BAH-PEG42/plasmid: 100 µg/1 µg) for 6 hours, rinsed, and then cultured for another 48 hours prior to western blot assay. GFP expression was quantified by using Quantity One (Bio-Rad) and normalized to actin of each group. The data are expressed as mean ± SD, and * indicates p <0.05 versus G4.0 group.


