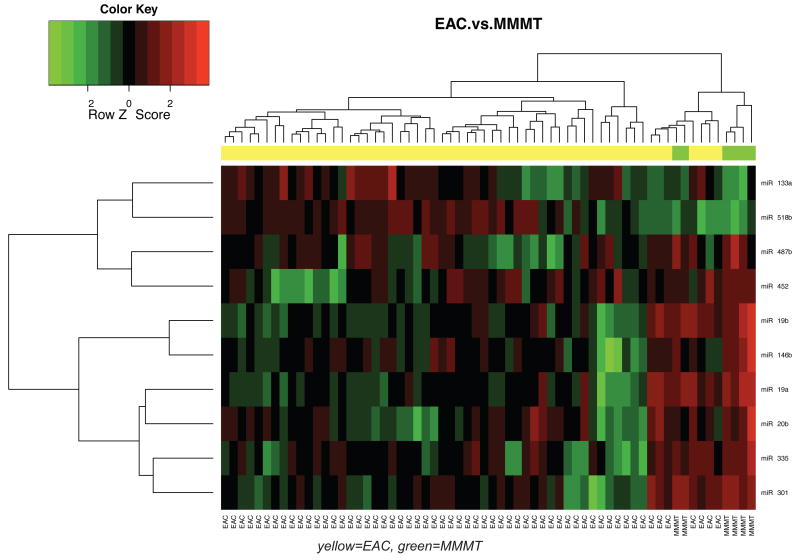
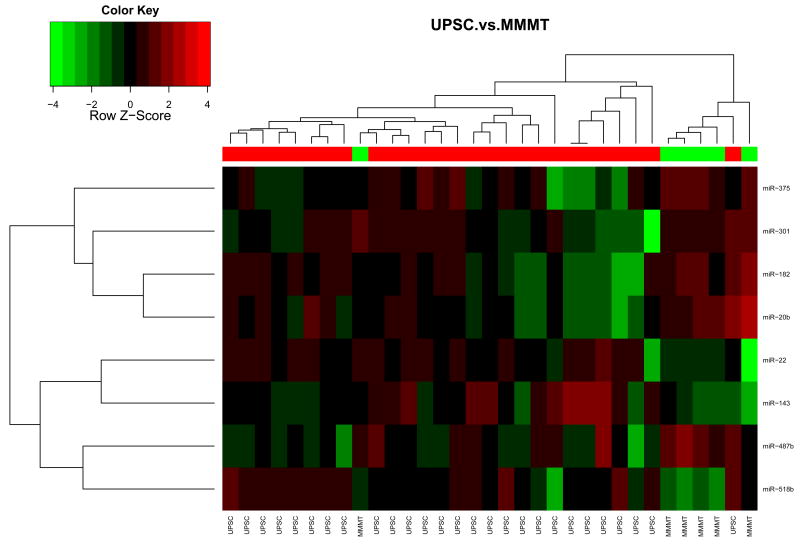
Figure 1. Comparison of miRNA expression patterns in endometrioid carcinoma, UPSC and carcinosarcoma.
A. A heat map of 6 Carcinosarcomas and 57 endometrioid endometrial carcinoma samples indicates that there is a difference in miRNA expression between the two groups. B. Comparison of 6 Carcinosarcomas and 27 UPSC show that there is a difference in miRNA expression between these groups. MicroRNA expression is displayed as higher (red) or lower (green).


