
Fig. 1.
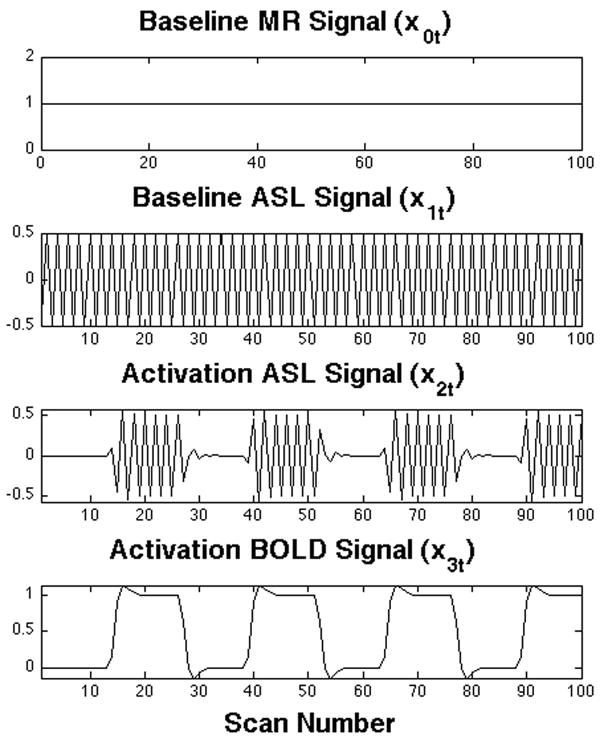
Simple ASL design matrix. Each plot represents one column (regressor) of the design matrix and its coefficient parameter (β). The first regressor indicates the baseline state signal, or spin density. The second regressor describes the baseline difference between control and tagged images (ΔM), is indicative of baseline perfusion. The third regressor describes ΔM changes due to activation. The fourth regressor describes residual BOLD effect changes.