
Fig. 2.
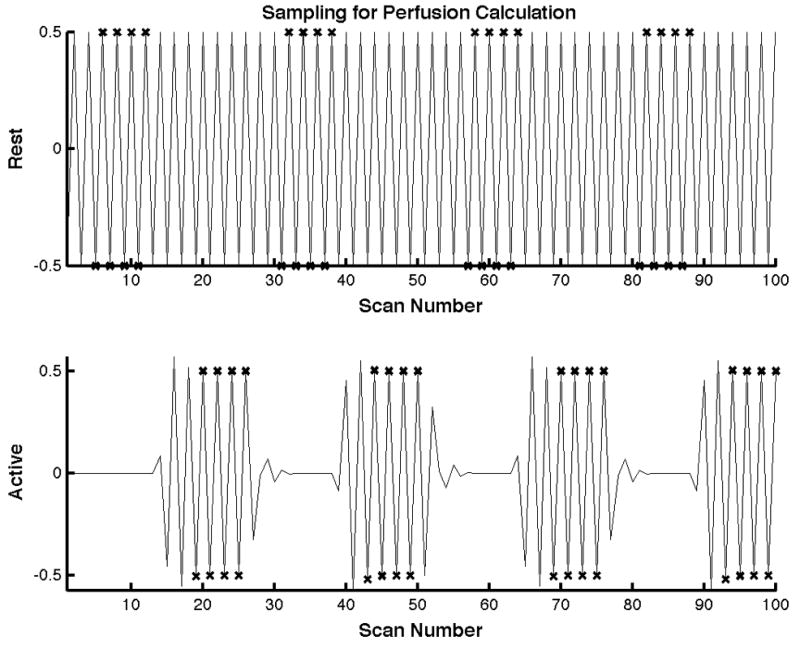
Samples used for perfusion estimation using the traditional method are shown for one block of the task. The top and bottom plots represent the baseline and active state ASL signals respectively. Samples close to the transition from baseline to active and vise versa were not used for estimation. The samples used for computation of the mean active and baseline state perfusions are marked with an × respectively.