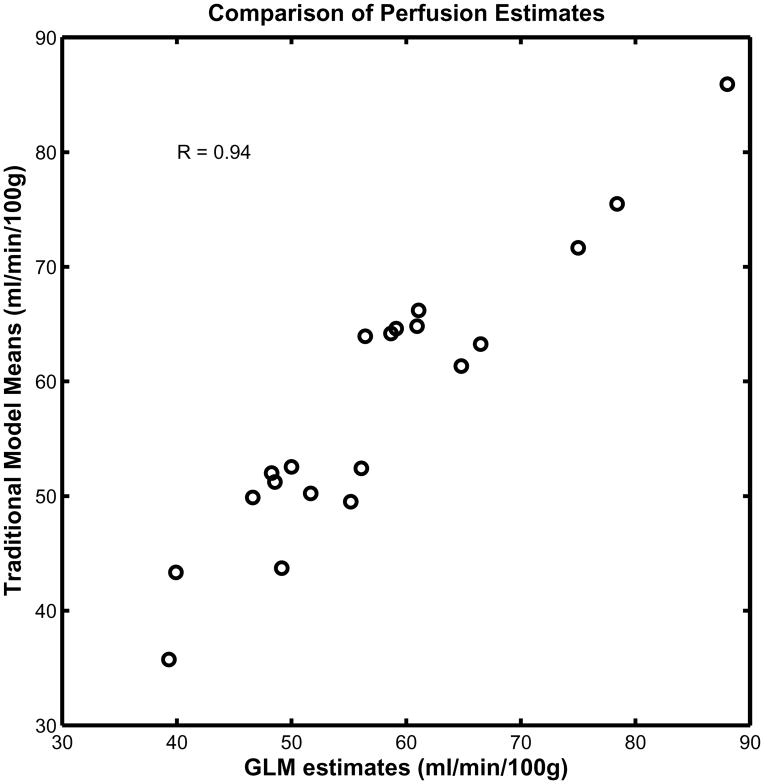
Fig. 8.
Comparison of perfusion estimates using GLM and traditional approach: Scatter plot of perfusion in ROIs places on visual and motor cortices during baseline and activation for 5 subjects estimated using Traditional approach (y axis) versus GLM approach (x axis) is presented. As can be seen, there is a significant correlation between perfusion estimates of these two methods (r=0.94).

