
Figure 3.
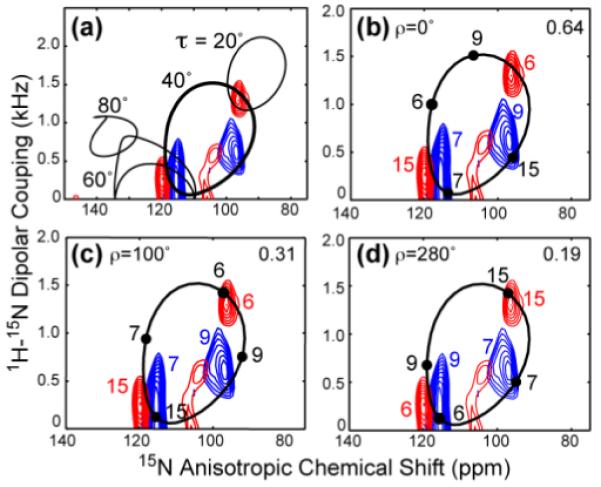
Simulated orientation-dependent spectra of the KvAP S4 peptide. (a) Simulated 2D 15N-1H dipolar and 15N CSA correlation spectra (black lines) overlaid with the sum of the two experimental spectra of Fig. 2b, c. Best fit is τ=40° ± 5°. Simulated spectra used a general order parameter of 0.8, estimated from Fig. S4 57. (b-d) Simulated 2D spectra for τ = 40° and different ρ angles. (b) ρ = 0°. (c) ρ = 100°. (d) ρ = 280°. The assignment in the simulated spectra is annotated in black, while the assignment for the experimental spectrum is shown in color. The RMSD between the calculated and measured spectra is indicated in the upper right corner of each panel.