
Figure 4.
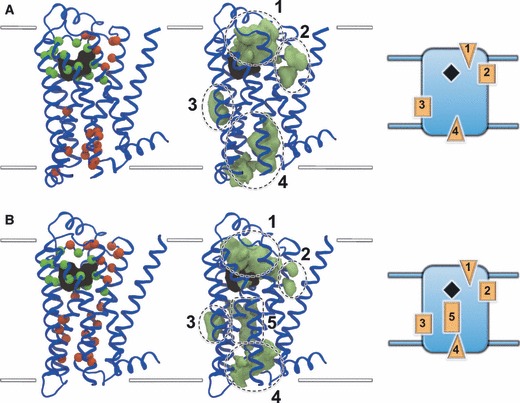
Principal non-orthosteric interaction sites on β1AR (A) and β2AR (B). Top 40 residues interacting with probe molecules are shown on the left, with orthosteric residues shown as green spheres and non-orthosteric residues shown as red spheres. Probes binding to the non-orthosteric residues are shown in the center as green densities that have been clustered into five key regions, four of which are shared between both receptors and one of which is exclusive to β2AR. A schematic depiction of the receptors and their key non-orthosteric sites is shown on the right, with solvent-exposed regions shown as triangles and lipid-exposed regions shown as rectangles. Receptors are shown in blue cartoon representation and depict the experimental conformation. The superimposed co-crystallized ligands are shown in black molecular surface representation. Approximate limits of the bilayer are shown as white lines.