
Figure 6.
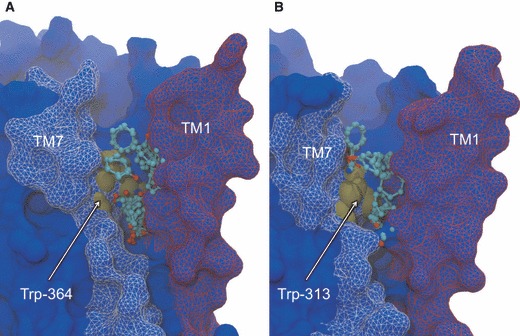
Non-orthosteric Site 2: the TM1–TM7 cavity of β1AR (A) and β2AR (B). Side view of the cavity taken in the plane of the bilayer, depicting bound probe molecules and the key interacting tryptophan residue. Bound probe molecules are shown in ball-and-stick representation and colored by atom type. Tryptophan residue is shown in brown space-filling representation and labeled. Receptors are shown in blue molecular surface representation, with TM1 colored red and TM7 colored white. The experimental conformation of the receptor is shown.