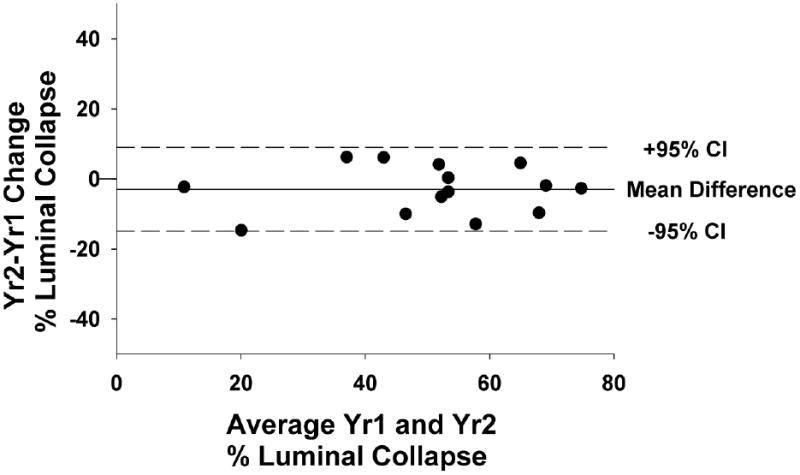
Figure 4.

Bland-Altman plot. Change in % expiratory luminal collapse is plotted against the average of Year 1 (Yr1) and Year 2 (Yr2) % expiratory luminal collapse. Bold horizontal line represents mean difference (-3%), and dashed horizontal lines represent the 95% confidence interval range (± 13%) [CI = confidence interval].
