
Figure 4.
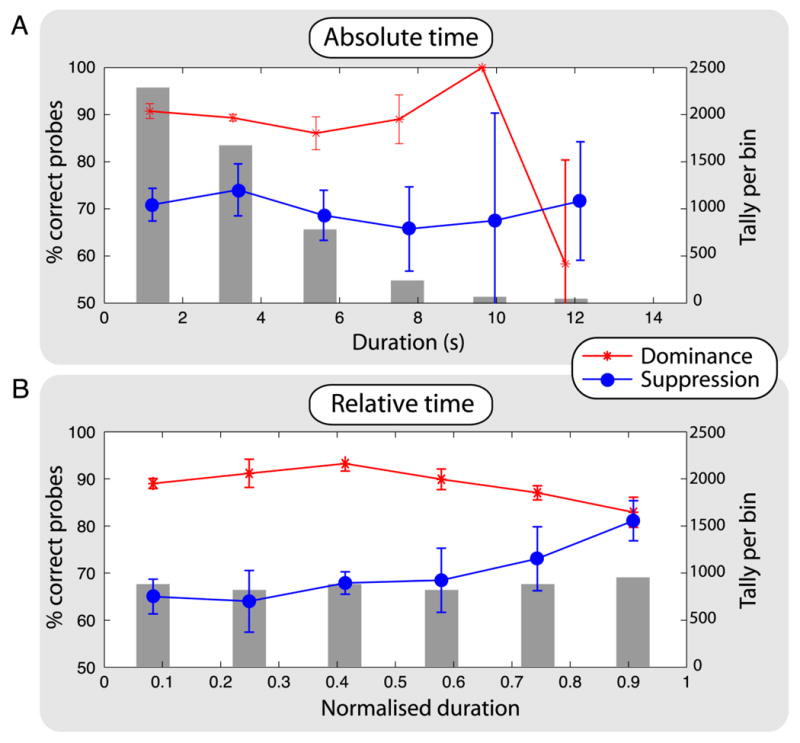
Results from Experiment 2. (A) The data points and lines show group means with standard error of those means for probe-detection performance (left-hand y-axis) for each rivalry state, as a function of time after onset of that state (advanced by 450 ms to correct for observers' latency in responding to perceptual changes, although any value from 400 to 650 ms produces similar results) plotted on the x axis. We sorted times into six equal-width bins for dominance and for suppression (the range of times for dominance was slightly smaller than that for suppression). The grey bars show the number of observations in each time bin (right-hand y-axis), summed over dominance and suppression with all observers pooled. Performance is better for dominance (red trace) than for suppression (blue trace), and there is no clear change in relative performance as a function of time. The grey bars show the typical gamma-shaped distribution of dominance times, explaining why probe performance data become so noisy in the last two time bins: there are very few observations in them. (B) The data from panel A recoded as relative time by normalising to the maximum time of each episode of rivalry. Normalising the state durations equalises the number of probes in each bin and reveals a clear change in relative performance over time. In the later time bins, dominance performance drops and suppression performance increases, consistent with the effects of adaptation on reciprocal inhibition.