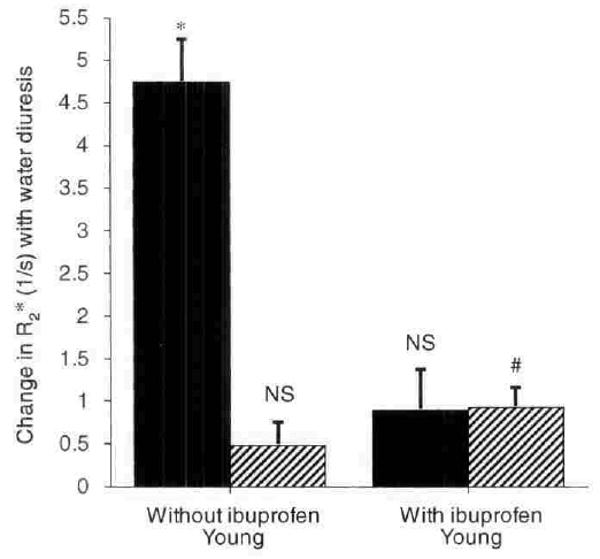
Fig. 3. Comparison of changes in R2* (1/s) in response to waterload in 6 young subjects with and without cyclooxygenase inhibition with ibuprofen.

Symbols are: (■) medulla; (▨) cortex. Columns are mean ± sem. NS implies not significant. * implies P < 0.01; # implies P < 0.02.
