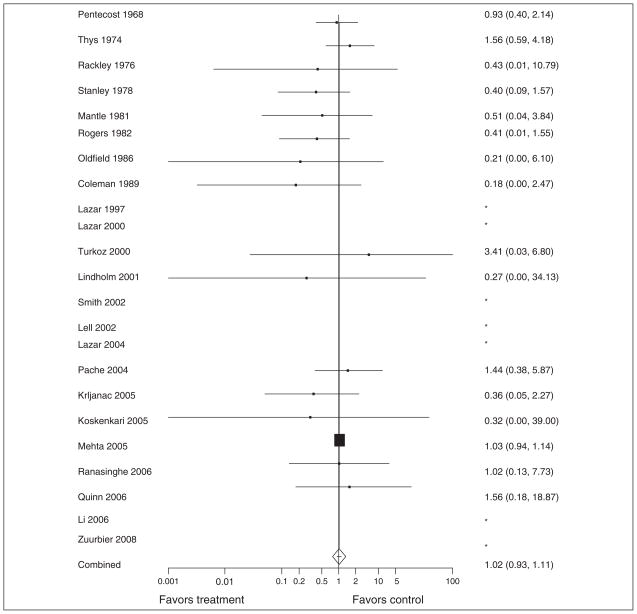
Figure 2.
Forest plot of all included studies. Odds ratios with 95% confidence intervals are shown on the right and the corresponding study is shown on the left. *Studies that were excluded from the summary odds ratio calculation because there were no occurrences of the primary outcome in the study.

