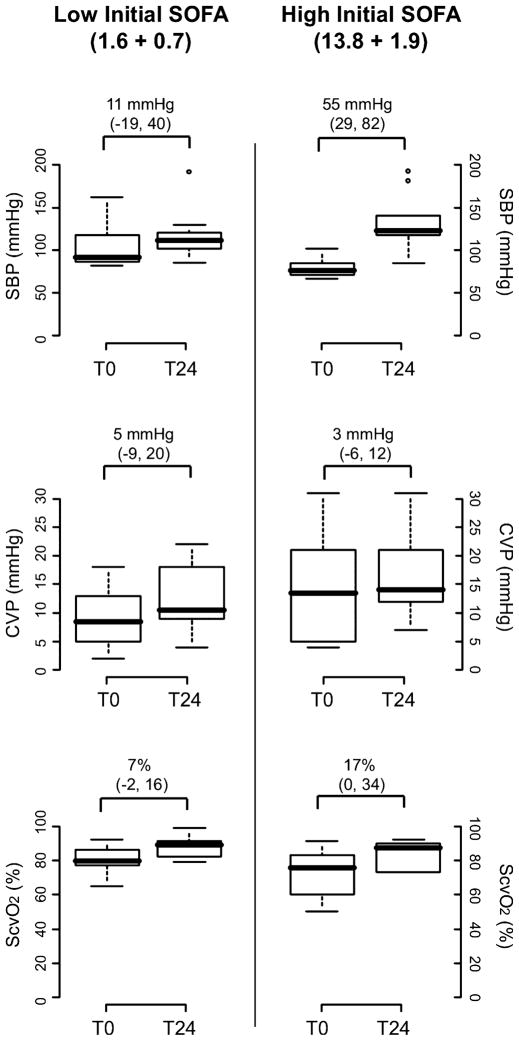
Figure 2.
Results of resuscitation protocol. Patients were included in the study on the basis of presenting SOFA score (see text for details). This figure shows the change in three key physiologic measures that both guided the intensity of resuscitation and reflected its success, the sBP, the central venous pressure, and the ScvO2. Summary measures are shown, divided by low-and high-SOFA groups, at presentation (t0) and as the best value measured over the first full day after resuscitation (t24). Box plots represent 5th, 25th, 50th, 75th, and 95th percentiles. Asterisks represent extreme values. Values over the box pairs represent the mean difference between groups and that difference’s posterior 95% credible interval. See text for details. CVP = central venous pressure; sBP = systolic blood pressure; ScvO2 = central venous oxygen saturation.

