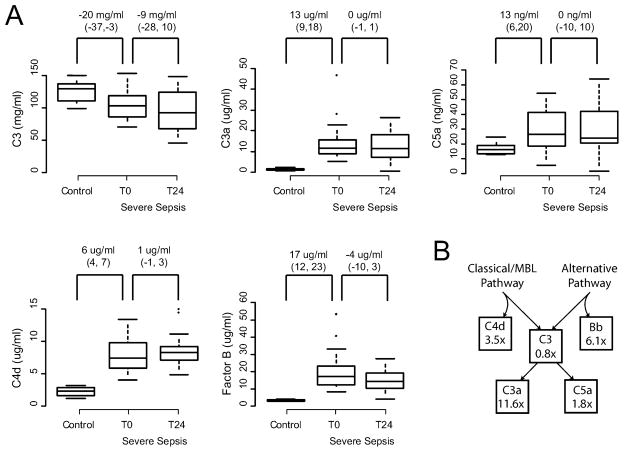
Figure 3.
Serum complement protein concentrations. 20 patients with severe sepsis and 10 healthy controls were studied. (A) Among septic patients, measurements were made at the onset of resuscitation (t0) and 24 hours later (t24). Box plots represent 5th, 25th, 50th, 75th, and 95th percentiles. Asterisks represent extreme outliers. Values over the box pairs represent the mean difference between groups and that difference’s posterior 95% credible interval. See text for details. C3 levels were significantly depressed at presentation and thereafter, and all other measured mediators were significantly elevated in patients over controls. No significant resolution of these abnormalities was detected 24 hours after the onset of standardized quantitative resuscitation. (B) The mean fold change over control values of each protein concentration in severe sepsis, by position in the complement pathway. Values here map to those reflected in the complement pathway shown in Figure 1. 95% credible intervals are reported in the text. MBL = mannose-binding lectin.

