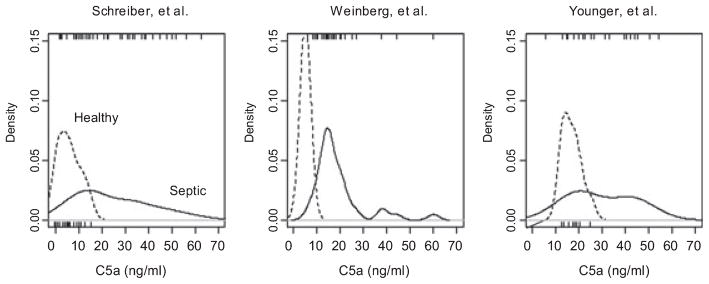
Figure 4.
Observed distributions of C5a concentration in previous reports by Schreiber et al.,7 Weinberg et al.,8 and in our data. Distributions are plotted using Gaussian smoothing. The vertical axis is scaled as to make the curves formal probability density functions (i.e., their areas equal 1). Individual data points from each source are plotted as rugs beneath (for control patients) or above (for septic patients) each graph with the exception of the Weinberg control data, for which the original report provided only a mean and standard deviation, not individual data points. All three data sets reflect a long rightward tail. The rightward shift in control values of approximately 10 ng / ml in our data may reflect the use of serum rather than plasma for protein determinations in the current work.

