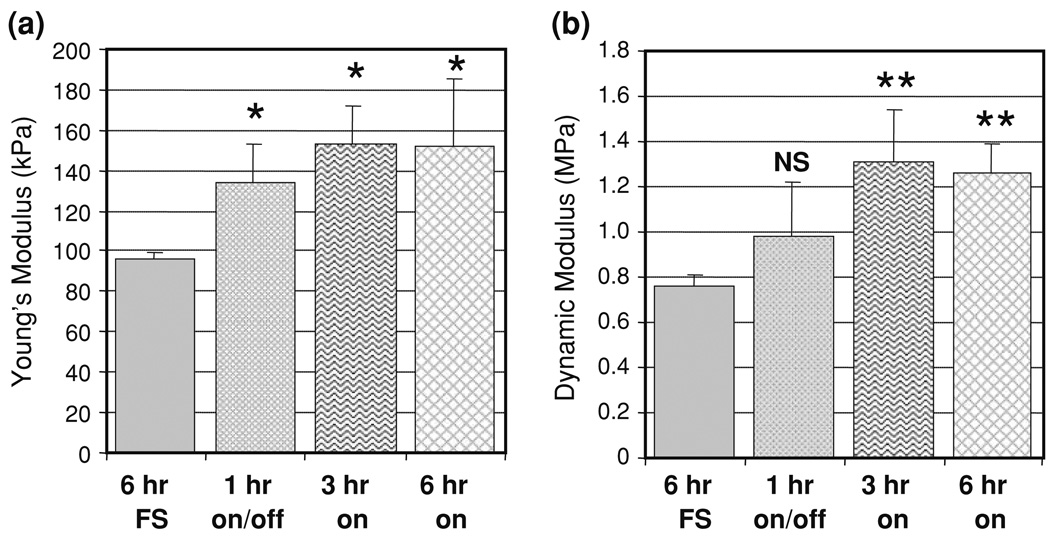
FIGURE 3.
Effect of a variation in duty cycle on (a) Young’s modulus and (b) 1 Hz dynamic modulus on day 28. Data presented as the mean and standard deviation of 3–4 samples. NS indicates no significant difference (p > 0.05) from the free-swelling group, * indicates significant difference (p < 0.05) from free swelling condition, ** indicates significant difference (p < 0.05) from both free-swelling and 1 h on/1 h off loading conditions.

