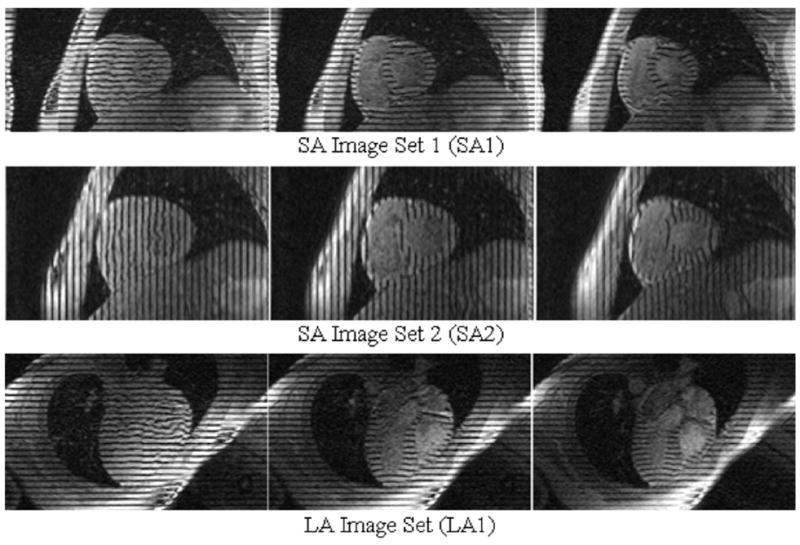
Fig. 3.

Tagged MR Data. The data consists of two sets of orthogonal SA images and one set of LA images. For each set, one image is shown at three different time frames for one half of the cardiac cycle from end-diastole (left) to end-systole (right). For each slice, the tag lines begin as parallel stripes then deform with the movement of the underlying heart tissue.
