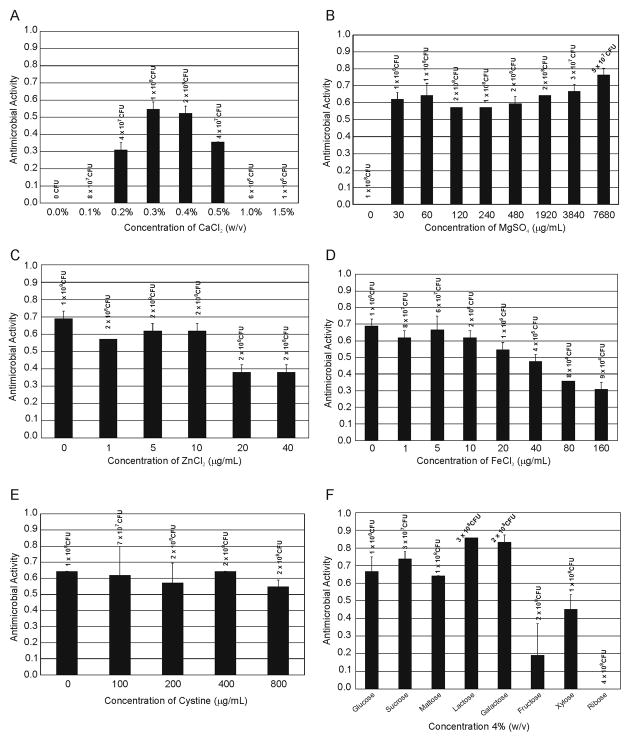
Figure 1.
Optimization of mutacin 1140 production. A. CaCl2 concentrations ranging from 0.0 to 1.5 % were tested and the CFUs are listed above the concentrations. B. MgSO4 concentrations ranging from 0.0 to 7,680 μg/mL were tested and the CFUs are listed above the concentrations, C. ZnCl2 concentrations ranging from 0.0 to 40 μg/mL were tested and the CFU are listed above the concentrations, D. FeCl3 concentrations ranging from 0.0 to 160 μg/mL were tested and the CFUs are listed above the concentrations, E. Cystine concentrations ranging from 0.0 to 800 μg/mL were tested and the CFUs are listed above the concentrations, F. Monosaccharide and disaccharide sugars at 4% (w/v) concentrations were tested and the CFUs are listed above each sugar tested.

