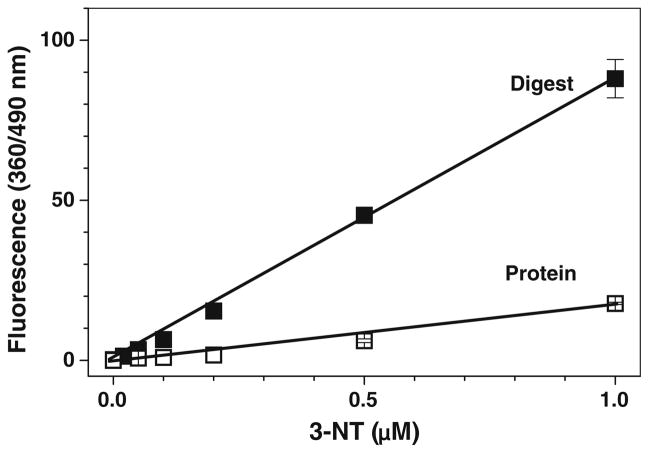
Fig. 13.
The dependence of fluorescence intensity (excitation and emission wavelengths of 360 and 480 nm, respectively) on the concentration of 3-NT after 3-NT reduction and tagging of whole phosphorylase b (open squares) or protein digest (solid squares) with 2 mM ABS and 20 μM K3Fe(CN)6. The total amount of protein in the samples was maintained at 100 μg; the 3-NT content was altered through mixing of native and nitrated protein at certain ratios

