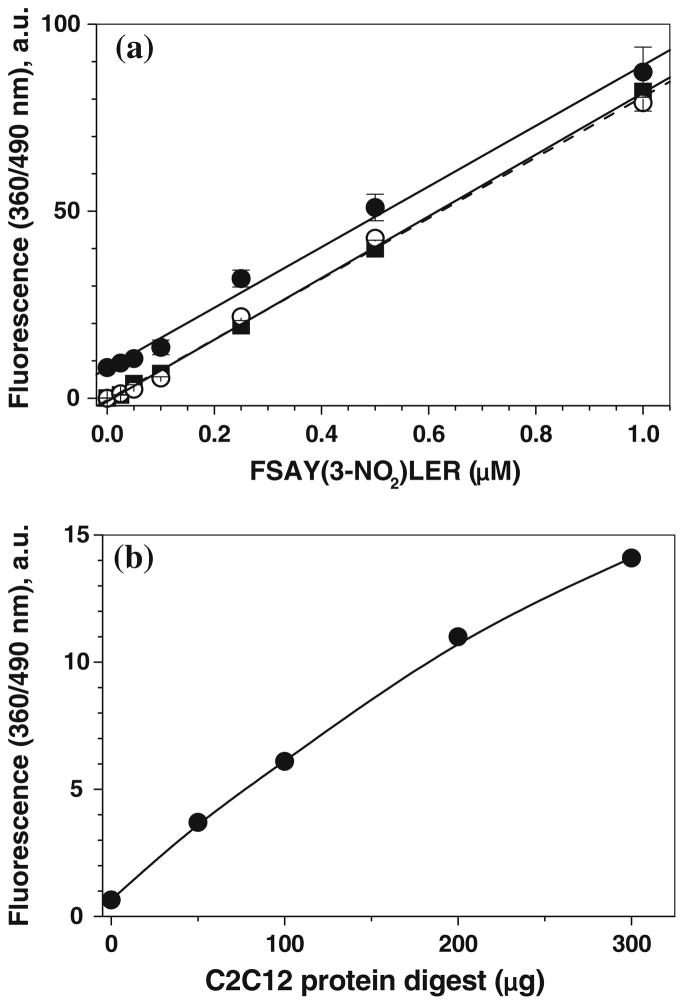
Fig. 9.
a Calibration of FSAY*LER in the absence (open circles) and in the presence of 100 μg digested C2C12 cell proteins (solid circles). Solid squares connected with dashed line represent the result of background fluorescence subtraction. b The dependence of background fluorescence (in the absence of 3-NT peptide) on the amount of protein digest. Fluorescence was measured at excitation and emission wavelengths of 360 and 490 nm, respectively, after 3-NT reduction and tagging with 2 mM ABS and 20 μM K3Fe(CN)6 for 1 h at room temperature

