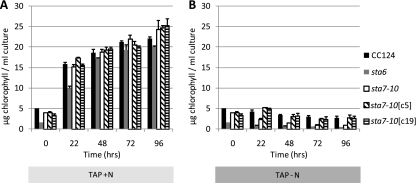
Fig. 7.
Chlorophyll content per ml of culture in a representative experiment at the specified time points for the CC124, sta6, sta7-10, sta7-10[c5], and sta7-10[c19] strains in nitrogen-replete (TAP) (A) or nitrogen-depleted (TAP-N) (B) medium. Values are representative of triplicate biological samples. Cells were precultured to late log phase and then resuspended at 2.0 × 10⁶ to 2.5 × 10⁶ cells/ml in either TAP or TAP-N medium. Error bars indicate standard deviations.

