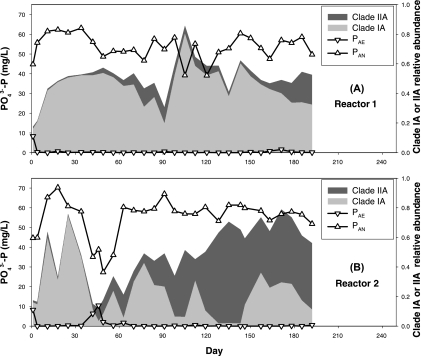
FIG. 2.
Reactor performance, total “Ca. Accumulibacter” abundance, and clade composition from R1 and R2 during the 6-month normal operating period. (PAN and PAE indicate the soluble PO43−-P concentration at the end of an anaerobic or aerobic phase, respectively.) Relative abundances were measured by semiquantitative ARISA as described in the text.

