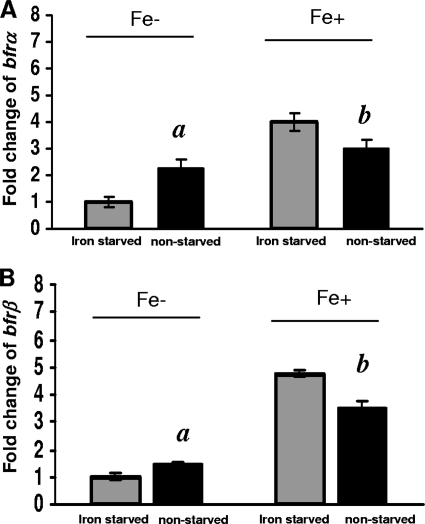
FIG. 3.
Comparison of bfrα and bfrβ expression levels in iron-starved and nonstarved cells in high- and low-iron medium. (A) Expression of bfrα. (B) Expression of bfrβ. For both genes, reporter activity is expressed as the fold change relative to iron-starved cells in low-iron (Fe−) medium. Values are means of single measurements from triplicate cultures (± standard deviations). Comparisons that were significantly different (P < 0.05) were nonstarved cells versus iron-starved cells in low-iron medium (indicated by “a”) and nonstarved cells versus iron-starved cells in high-iron medium (indicated by “b”).

