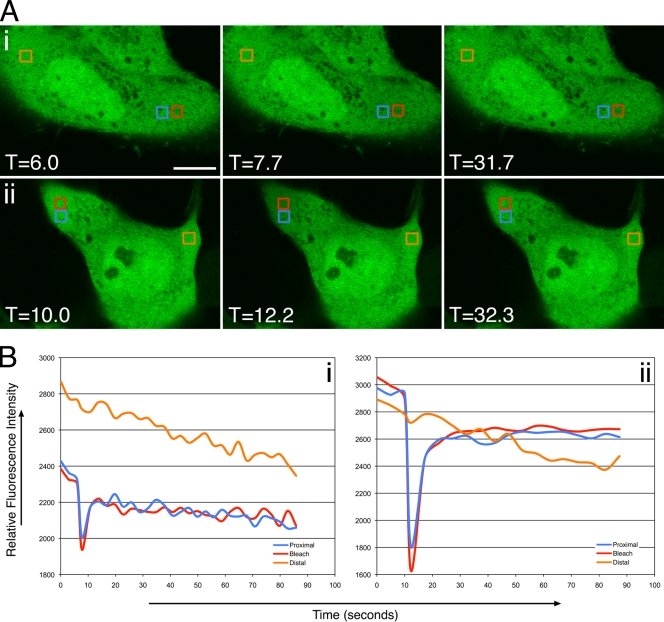
FIG. 6.
FRAP analysis of EGFP-D315A/D318A in the absence and presence of Us2. (A) Images of live PK15 cells cotransfected with pCIneo and EGFP-D315A/D318A (i) or Us2 and EGFP-D315A/D318A expression plasmids (ii) immediately before, immediately after, or 24 (i) and 20.1 (ii) s after the area outlined in the red box was photobleached using an Olympus FV1000 laser-scanning confocal microscope. The boxed blue area is proximal to the photobleached region, and the boxed orange area is distal to the photobleached region. The fluorescence signal is ERK2-EGFP. Scale bars, 10 μm. (B) Quantitation of the fluorescence intensity of the photobleached area, as well as control proximal and distal areas, over time. Data for PK15 cells cotransfected with pCIneo and EGFP-D315A/D318A (i) and cells cotransfected with Us2 and EGFP-D315A/D318A expression plasmids (ii) are shown.

