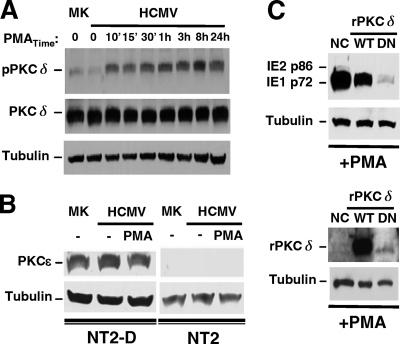
FIG. 3.
PKC-delta is abundant (unlike PKC-epsilon), and its phosphorylation at Thr505 coincides with PMA-induced MIE gene activation, which is inhibited by the ectopic expression of a dominant-negative PKC-delta. (A and B) The experimental design described in the legend of Fig. 1A was applied to analyze mock-infected (MK) and infected NT2 or differentiated NT2 (NT2-D) cells after PMA stimulation. Duplicate samples were pooled for Western blot analyses, and β-tubulin served as the internal control. (A) Amounts of total PKC-delta (PKCδ) and PKC-delta containing phospho-Thr505 (pPKCδ) were assessed at the indicated times of PMA stimulation in MK and infected NT2 cells. The ratio of pPKCδ to PKCδ was calculated for determinations of fold changes in levels of PKC-delta phosphorylation. (B) The amount of PKC-epsilon (PKCɛ) was assessed in MK and infected NT2 and NT2-D cells at 24 h poststimulation with and without PMA. (C) NT2 cells were transfected with equivalent amounts of a negative-control (NC) expression plasmid or a plasmid expressing Flag-tagged rat wild-type (WT) PKC-delta (rPKCδ) or dominant-negative (DN) rPKCδ at 24 h prior to infection and then treated by using the approach depicted in Fig. 1A. The amount of the MIE protein was assessed at 24 h poststimulation. The NC plasmid contains an SV40 promoter driving puromycin. Tagged WT and DN rPKCδ were detected with anti-Flag antibody. DN rPKCδ resulted in 93% and 90% decreases in PMA-induced IE1 p72 expression relative to NC and WT rPKCδ, respectively.

