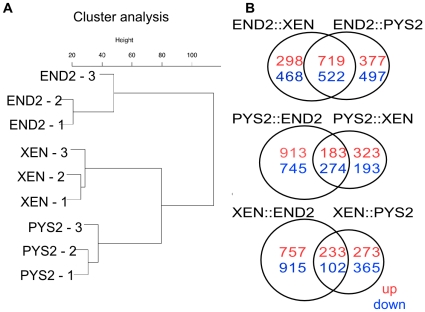
Figure 6. Cluster analysis of microarray data.
A. Cluster Dendrogram representing the amount of variance in markers commonly expressed through microarray analysis by each of the ExEn cell lines (in triplicates). B. Venn Diagrams representing the number of genes in the array that are either upregulated (red) or downregulated (blue) in pair-wise comparisons between the different cell lines. Probes are called as “present” if the p-value for detection was less than 0.01.

