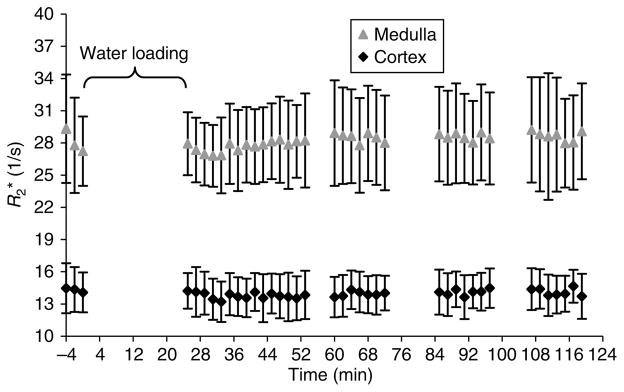
Figure 2. Time course of response to waterload with naproxen shown for the same subject as in Figure 1a.
The first three time points represent baseline measurements. Note that there is no significant change observed in the medullary R2* values post-waterload.

