
Figure 7.
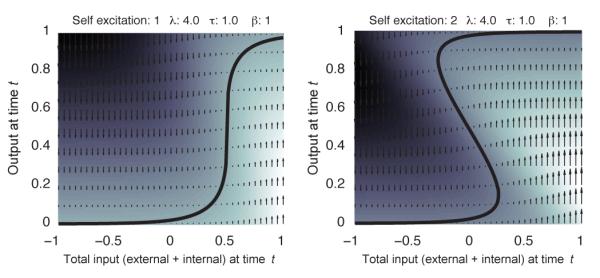
Phase plots for units with balanced (left) and strong (right) recurrent connections to themselves. Here equilibrium curves are plotted as solid curves, and velocities are plotted by arrows and shading (white corresponds to positive, black to negative velocities).