
Fig. 3.
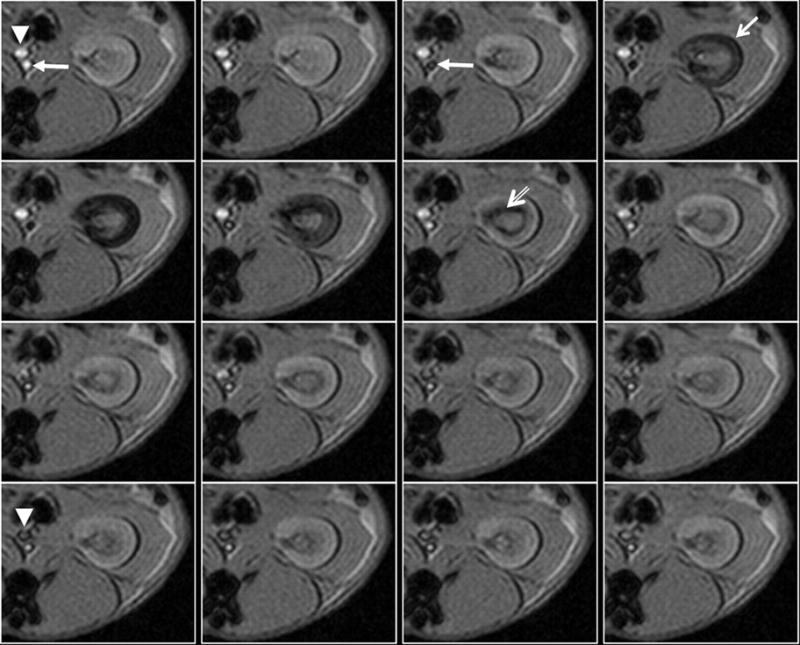
Use of intravascular contrast agents for perfusion MRI. Shown is a representative series of kidney images in a rabbit obtained using gradient echo sequence (TR/TE/FA = 15/3 ms/100) with a temporal resolution of 2 s (right to left and top to bottom). Ferumoxytol at a dose of 1 mg/kg was administered as a bolus through an ear vein, and the acquisition of MRI was simultaneously initiated. Marked in the 1st time frame (precontrast) are the abdominal aorta (solid arrow) and vena cava (solid arrowhead), respectively. Note in the 3rd time frame that the aorta goes completely dark. In the next time frame, the cortex gets dark (arrow), and by the 7th time frame the medulla goes completely dark whereas cortex recovers, and by the 13th time frame the vena cava becomes dark. Based on this type of dynamic scanning, one can obtain concentration vs. time profiles and fit them to appropriate mathematical models to extract various perfusion indexes (140).