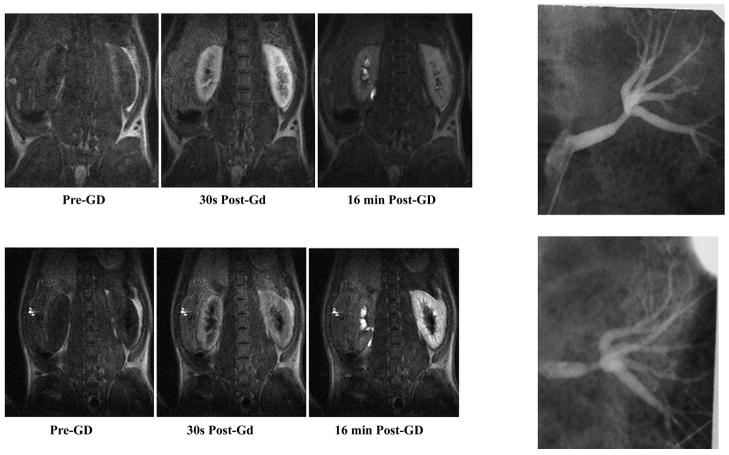
Fig. 4.
Illustration of renal function as evaluated by dynamic MRI following administration of Gd-DTPA, a positive contrast agent (i.e., with higher concentrations, the signal is increased). Shown are longitudinal relaxation (T1)-weighted MR images obtained in a chronic renal artery stenosis model in swine at representative time points following Gd-DTPA (0.05 mmol/kg) and following administration of captopril (118). The top row was obtained 1 wk postsurgical placement of an MRI-compatible ameroid constrictor around the renal artery (seen on the X-ray angiograms on the right). The bottom row was obtained in the same animal 5 wk later. Note the severity of the renal artery stenosis, especially the poststenotic vessel dilatation, a classic sign of hemodynamically significant stenosis. Whereas at week 1, the contrast washout is almost complete and symmetrical, at week 6, with the progression of stenosis to a point of being hemodynamically significant, the washout in the affected kidney is rather limited. Figure reproduced from Ref. 117 with permission from RSNA.

