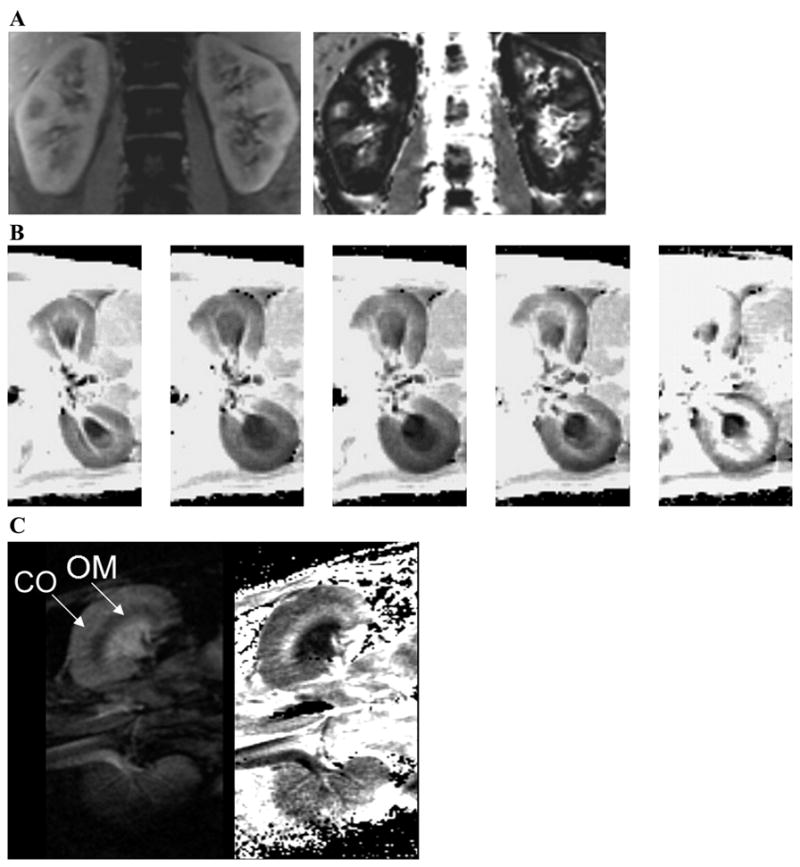
Fig. 5.

A: blood oxygenation level-dependent (BOLD) MRI data in human kidney. Shown are data acquired with a 3D sequence where the entire kidney in the coronal plane can be covered within a single breath-hold interval. Shown are images from 1 representative slice (of 6 acquired). Left: first image of 8 echo images acquired. Right: corresponding calculated rate of spin dephasing (R2*)map. The corticomedullary differentiation on both the anatomic image and R2* map are remarkable. The medulla appears darker on the T1-weighted anatomic images, whereas on the R2* maps it appears bright (signifying relatively low regional blood and hence tissue PO2). B: set of pre- and postpharmaceutical R2* maps in rat kidneys in the axial plane (500-μm in-plane and 3-mm slice thickness). While this was not performed to address any specific scientific question, it is a very nice demonstration of the advantage and efficacy of the technique. These images were all acquired within ~1 h, with about 10 min between administration of different agents. Furosemide stops the reabsorptive function along the medullary thick ascending limbs and thereby reduces the oxygen consumption in the medullary segments. Thus one can observe a reduction in the brightness of R2* maps in the medulla (lower R2* implies better oxygenation). ANG II is a vasoconstrictor that is commonly used, and we observed little effect on the R2* maps. However, following subsequent administration of N ω-nitro-L-arginine methyl ester (L-NAME) and norepinephrine (potent vasoconstrictors), there was a significant increase in R2*, predominantly in the renal medulla. C: BOLD MRI data in a mouse kidney. Shown are data acquired in a 24-g mouse using a dedicated 2-cm surface coil on a standard 3.0-T whole body scanner (same as for A and B). This figure provides clear indication of the power of the technology in terms of its scaling and how observations could be translated from a mouse models to humans very easily. Shown are 1 representative image (left; of 6 individual echo images) obtained in the coronal plane (160-μm in-plane and 500-μm slice thickness) and the calculated R2* map (right). CO, cortex; OM, outer medulla.
