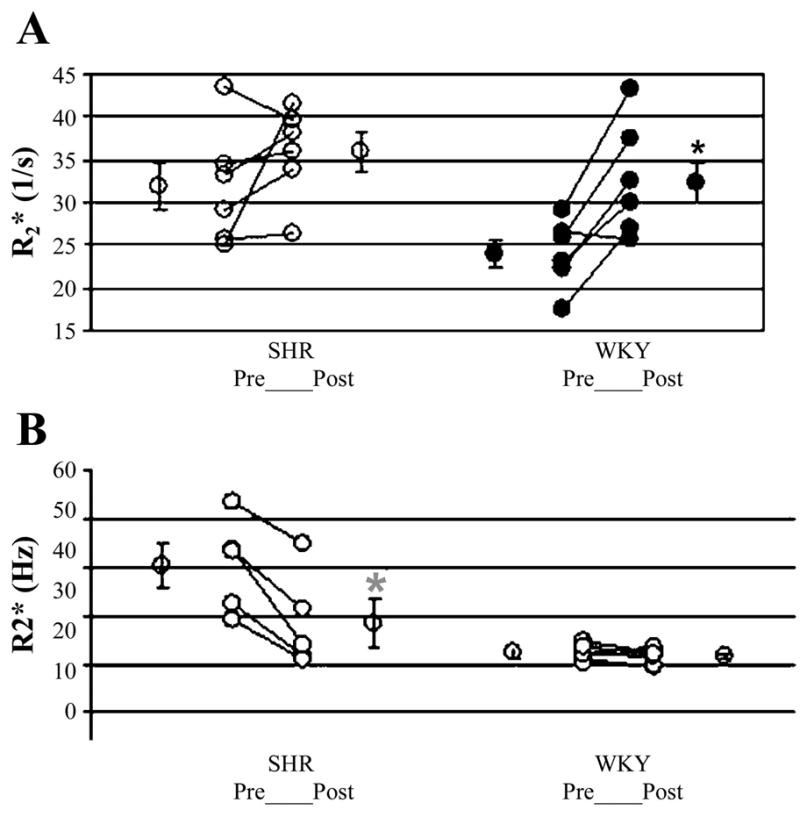
Fig. 6.

A: illustration of individual changes post-L-NAME in spontaneously hypertensive (SHR) and Wistar-Kyoto (WKY) rats. The average (means ± SE) of all points acquired at least 20 min after L-NAME administration was used as postmaneuver R2*. Mean R2* values pre- and post-L-NAME in the renal medulla were averaged over all rats of each strain. WKY rats showed significant response to L-NAME in the medulla, as evaluated by BOLD MRI measurements. SHRs did not show significant response to L-NAME. Also, note that the pre-L-NAME, R2* in SHRs is similar in magnitude to post-L-NAME in WKY. Figure reproduced from Ref. 75 with permission from Wiley InterScience. B: illustration of individual changes posttempol in SHR and WKY rats. Average (means ± SE) of all points acquired at least 20 min after tempol administration was used as postmaneuver R2*. Mean R2* values pre- and posttempol in the renal medulla were averaged over all rats of each strain. SHR showed significant response to tempol in medulla, as evaluated by BOLD MRI measurements. WKY rats did not show significant response to tempol. Figure reproduced from Ref. 74 with permission from Wiley InterScience.
